

Alasdair’s Engineering Pages © A. N. Beal 2024 www.anbeal.co.uk


www.anbeal.co.uk


The Structural Engineer, Vol. 82 No. 22, 16th November 2004
A bit windy? Anomalies in BS 6399-
A N Beal BSc CEng MICE FIStructE
Alasdair Beal (F) argues that several aspects of the new wind code are open to different interpretations and suggests a way forward
One only needs to go back to R. G. Taylor’s wonderfully-
Complexity
Even in this computer age, simplicity in calculations is still a virtue: over-
BS 6399-
There are also rules which appear simple in the Code but generate surprising complexity in practice. For example, for external wind pressures BS 6399-
Furthermore, for a pitched roof BS 6399-
These may seem like minor gripes. However consider the roof of a typical shed with (say) four different-
Even if the engineer had the time to work out all these different wind pressures and to design all the possible variations of cladding fixings, purlin sizes, connection details etc. to take full advantage of them, the proliferation of different section sizes and details would make the structure hopelessly uneconomic and impractical to build. Modern commercial design relies on rationalisation and repetition of sections and details to achieve maximum economy -
The main cause of the proliferation of design wind pressure values is the ‘size effect factor’ Ca. It can generate a different internal pressure for every room size (see later) and the values for external pressures are presented on a large-
It is worth remembering that the practical range of variation of Ca is actually quite small: over the realistic range of building sizes, it almost always falls in the range 0.75-
(For a building in town at least 10km from the sea and He ≤ l0m, or in town 2-
Size matters -
BS 6399-
It can easily be demonstrated that neither of these is correct. A ‘tributary area’ is a convenient calculation shortcut but it is not the same as the area contributing load to the beam. Fig 1a shows influence lines for the reaction on a beam. As can be seen, the area which contributes load to the beam when it is loaded for maximum reaction is always wider than the ‘tributary area’: for an individual beam, the loaded area extends across the full panel width on each side of the beam and for flexible beams with some load-

Fig. 1a
Influence line for reaction at central support of continuous beam
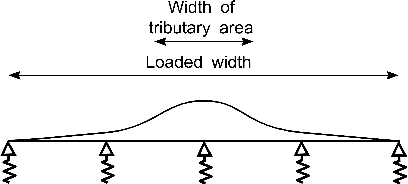
Fig 1b
Influence line for reaction at central support of continuous beam on flexible supports

Fig. 2a
Loaded area for calculation of a: stiff beams, no loadsharing
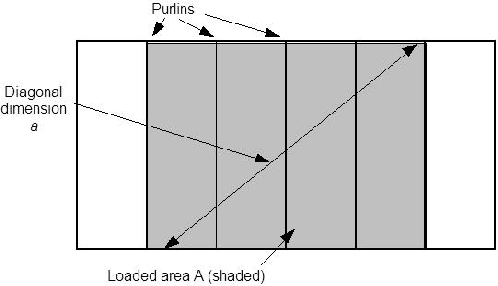
Fig. 2b
Loaded area for calculation of a: flexible beams with loadsharing
The SCI/BRE proposal to base a for double-
Multibay pitched roofs
Many industrial sheds have multibay pitched roofs and wind uplift is critical for the design of their roof sheeting, its fixings, the purlins and the roof beams or trusses. CP3 Chap. V Table 11 gave wind pressure coefficients for multibay roofs. However BS 6399-
Is an internal bay of a multibay roof:
(i) part of a series of troughed roofs (negative pitch)? or
(ii) part of a series of ridged roofs (positive pitch)?
If (i) is correct BS 6399 Table 10 gives a suction coefficient of -
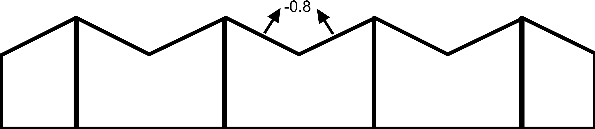
Fig 3a. Cpe -

Fig 3b. Cpe +15° pitch roof, (BS 6399-
The ‘penthouse problem’
BS 6399-
If the walls of the building extend flush-
An odd feature of this clause is that this 50% pressure increase appears to apply regardless of whether the inset of the upper walls is 0.3m or 30m and regardless of whether the inset is at low level or near the top of the building. Is there something wrong with the scaling rules in this clause, which adjust its effects for varying proportions of buildings?
Internal pressures
Internal pressures are normally thought of as rather mundane but they form an important part of the loading on many structural elements. They are difficult to calculate precisely, so engineers using CP3 Chapter V were usually content to follow its recommendation (Appendix E) that:
‘Where it is not possible, or is not considered justified, to estimate the value of Cpi, for a particular case, .... where there is only a negligible probability of a dominant opening occurring during a severe storm, Cpi should be taken as the more onerous of +0.2 and -
BS 6399-
(i) two opposite walls equally permeable, other faces impermeable: internal pressure coefficient -
(ii) four walls equally permeable, roof impermeable: internal pressure coefficient -
These coefficients are then multiplied by coefficient Ca with a = 10 ³√(internal volume of storey).
No advice is given for any other types of building. There is also another problem: what exactly does (ii) mean? Is the internal coefficient -
“... and I’d like to have a partition here”
Where there are internal walls with internal doors which are either kept open, or else more than three times more permeable than the external doors, BS 6399-
Consider a shed measuring 50m (L) x 25m (B) x 12m (H) with a dynamic wind pressure of 1kN/m², designed in accordance with the BRE/SCI guide. If the roof external pressure coefficient is -
At some point in the life of almost every building, someone will erect walls inside it, perhaps to divide the space, or for office areas, or for subletting. If the design does not allow for this, owners and tenants will need to be notified that they cannot erect internal partitions without first strengthening the roof fixings and supports. This would also need to be recorded in the CDM Health & Safety Plan and sale and letting particulars -
Is internal pressure constant?
When the wind blows past a building, more wall areas have negative external pressure coefficients than positive, so if all the walls are equally permeable it is reasonable to assume that the air pressure inside the building will be reduced. However is it reasonable to assume that this reduction is constant for all wall permeabilities?
Consider a building with four walls of exactly equal permeability and an impermeable roof Imagine what happens if the permeability of the all walls is progressively reduced. We know that if the walls are completely impermeable, the wind outside will have no effect on the air pressure inside, so Cpi must be 0.0. It is reasonable to deduce from this that as the wall permeability is reduced towards zero, the internal pressure change induced by the wind must also reduce towards zero. A lot of research would be necessary to work out the full relationship between wall permeability and internal wind pressure (particularly when wall permeabilities are not exactly equal) but this simple ‘thought experiment’ is sufficient to establish two important points:
i) the internal pressure cannot be a constant proportion of the external wind dynamic pressure for all wall permeabilities and
ii) where the wall permeability is low, it cannot be correct to assume that the internal pressure coefficient is always -
‘All walls equally permeable’?
How valid is it to design real buildings on the assumption of ‘four walls equally permeable’? BRE Digest 436 (Q 43) states that the definitions of ‘permeable’ and ‘impermeable’ are relative and may be distinguished by a factor of 2. It also acknowledges that ‘In general, faces with opening windows and doors or ventilators will be permeable and faces without openings (masonry, profiled metal cladding etc.) will be impermeable’ -
Very few real buildings have (even nominally) ‘four walls equally permeable’. The side walls are often fairly impermeable but the rear wall usually has at least one door or window and the front wall almost always has one or more doors and one or more windows; roofs and walls also commonly have air vents. Then there are the vagaries of real construction: at the design stage the actual permeabilities of walls are rarely known to any accuracy and even for nominally identical construction the real permeability may vary considerably in practice. Finally, wear and tear and also building alterations should be considered: flues and extractor fans may be installed and new door and window openings may be formed. All these things may play havoc with calculations based on idealised assumptions -
Recommended internal pressures for design
When all of the above is taken into account, it is difficult to see how the idea of designing standard commercial sheds for a constant internal pressure coefficient of -
It should be noted that BS 6399-
Dominant openings
In BS 6399 Cl. 2.6.2 the internal pressure when a dominant opening is open in a storm is superficially similar to CP3 Chapter V: depending on its size, it is based on either 75% or 90% of the pressure outside the opening. However, because of differences in the way the pressure is calculated, the results are quite different from CP3.
In CP3, normal practice (rightly or wrongly) was to base the external wind pressure at the dominant opening (and thus the internal pressure) on:
(a) exposure class based on overall dimensions of the building (e.g. Class 3B or 3C) and
(b) wind pressure coefficient based on height of top of door opening.
In BS 6399, the pressure caused by the dominant opening is based on:
(a) external pressure based on the height of the top of the building and
(b) the size effect factor Ca based on the diagonal dimension a of the opening, or the volume of the room or building storey containing the opening (a = 0.2x ³√(internal volume of storey)), whichever is greater.
The practical effect of the CP3-
To determine whether an opening is ‘dominant’, BS 6399-
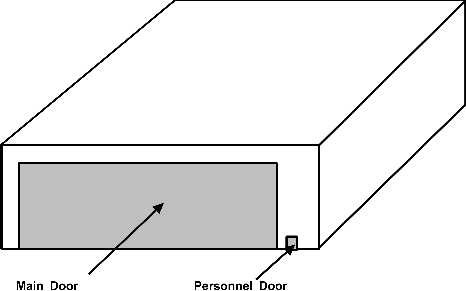
Fig. 4
Dominant openings
Consider a hangar on a site in the country measuring 50m (L) x 50m (B) x 18m (H), with two doorways in its front wall: a main door 40m wide x 15m high and a smaller personnel door 1.5m wide x 2. lm high (Fig 4). Assume that the design external wind pressure on the front wall is 1kN/m².
Firstly the ‘sum of remaining openings and distributed porosities’ on the side and rear walls must be calculated. Their area is 2700m² and if their porosity is taken as similar to office curtain walling (3.5 x 10-
(i) building volume = 0.2³√(internal volume) = 7. 1m, giving Ca = 0.98;
(ii) for the main doorway, a = 42.7m and Ca =0.84;
(iii) for the personnel doorway, a = 2.6m and Ca = 1.00.
If the main doors are left open in a storm, (ii) governs, so the internal pressure = 0.9 x 0.84 x 1kN/m² = 0.76kN/m². However if the personnel door is left open, (i) governs and internal pressure = 0.9 x 0.98 x 1kN/m² = 0.88kN/m².
Therefore, according to BS 6399-
The problem appears to arise because Ca is based on the diagonal dimension of the doorway, which gives the average pressure on the door when it is shut -
Probability and serviceability
BS 6399-
What does this mean? A ‘serviceability limit state’ is normally a limit on cracking, deflexion etc. and in most cases it is impossible to satisfy this without also satisfying the ‘ultimate limit state’. However if this was the intended meaning, Cl. 2.6.1.3 would make no sense at all. What did the BS 6399-
The SCI Guide proposes (p. 48) that the Cl. 2.6.1.3 ‘serviceability limit state’ should be considered as equivalent to an accidental limit state, checking the design against failure using a load factor of 1.0. However this contradicts everything said on the subject of limit state design in BS 8110, BS 5950 and BS 5628, which define completely different performance criteria for ‘serviceability limit states’ and ‘accidental limit states’. BS 6399-
BRE Digest 436 Part 1 (Q 46) suggests checking the ‘serviceability limit’ at a reduced wind speed, with Sp = 0.8 applied to the characteristic wind speed, reducing the design dynamic pressure to 64% of the characteristic value; this is said to correspond to ‘a return period of 2 years’. The SCI Guide makes a similar suggestion but describes the loading probability as ‘a mean recurrence interval of 1.8 years’. However BS 6399-
However the strange affair of Cl. 2.6.1.3 does not end here. What is the origin of that curiously-
This analysis contains two major errors.
(i) The partial factors on loads used in ultimate limit state design are safety factors, not estimates of real loads. The values in present UK limit state codes were selected on a fairly arbitrary basis by the CP110 committee in the early 1970s and have stayed more or less unchanged since then. They have no rigorous scientific or technical basis and they tell us nothing useful about wind loadings.
(ii) If a code says that γf = 1.4 for the ‘ultimate’ load and γf = 1.0 for the ‘serviceability’ load, this means ultimate load = 1.4 x characteristic load and serviceability load = 1.0 x characteristic load. It does not mean serviceability load = 1.0/1.4 x characteristic load.
Despite its apparent precision, the derivation of Sp in BS 6399-
Conclusions
* When calculating Ca for a beam or column, the diagonal dimension a should be based on a loaded area of the full panel width on each side of the beam, not the smaller ‘tributary area’ recommended by the BRE Digest and the BRE/SCI Guide. Where a beam is flexible and may share load, a loaded area of two panel widths on each side may be taken (see figs. 2a and 2b).
* The size effect factor Ca, for external pressures could be simplified with little loss of accuracy, greatly reducing the number of different wind pressures generated for design (see Table 1).
* The BS 6399-
* The rules for wind pressures on walls of buildings with inset upper storeys appear to give odd and very onerous results in some situations.
* The BS 6399-
* The calculation of internal pressures could be simplified by incorporating Ca into Cpi, giving coefficients of -
* The BS 6399-
* Where a dominant opening is unlikely to be open in a storm, it is reasonable to use a reduced wind speed for estimates of internal pressure. However the BS 6399-
Acknowledgments
Thanks are due to my colleagues Adam Nycz and David Hart for their help in identifying the problems discussed in this paper.
References
1. ‘Blow, blow thou winter wind, th’art not so unkind as CP3 Chap. V Part 2’, Taylor, R. C., The Structural Engineer, V 51/12, Dec. 1973 and discussion V 52/9, Sept. 1974, IStructE, London.
2. BS 6399-
3. BRE Digest 43: ‘Wind loading on buildings: brief guidance for using BS 6399-
4. SCI Publication: ‘Guide to evaluating design wind loads to BS 6399-

The original copy of this paper is available from
|
a(m) |
Ca |
|
5 |
1.0 |
|
10 |
0.95 |
|
20 |
0.9 |
|
50 |
0.85 (0.80) |
|
100 |
0.80 (0.75) |
Table 1: Proposed table of size effect factor Ca for external pressures