

Alasdair’s Engineering Pages © A. N. Beal 2024 www.anbeal.co.uk


www.anbeal.co.uk


Proc. Instn Civ. Engrs, Part 2, 1986, 81, Sept., 397-
PAPER 9025 STRUCTURAL ENGINEERING GROUP
The design of slender columns
A. N. BEAL BSc, MICE, MIStructE
Associate, R. H. Thomason & Partners
A graphical method is proposed which allows rapid and accurate analysis of slender columns under both axial and eccentric loads, for linear and non-
Introduction
1. The theory of buckling of columns has a long history: the buckling load for a perfect pin-
P = π²EI/L² (1)
where P is the axial load, E is the elastic modulus, I is the moment of inertia and L is the effective length.
2. The situation where the material has a finite yield strength is more complex and has been the subject of considerable research. The development of rational theories for this has been well summarized by Godfrey [2]. The formula for stanchion strength in BS449 [3] is based on the work of the Steel Structures Research Committee in the 1930s, and is now arranged to provide a constant load factor against failure of 1.7, based on elastic theory and on the assumption that initial imperfections amount to a how of e0/h = 0.6(L/100h)², where e0 is the eccentricity and h is the section depth. However, tidy formulae are not available where behaviour is non-
3. The method for an exact theoretical solution is known -
4. A graphical method is proposed here which, once section moment -
Method for determining strength of slender columns
5. For any section it is possible to calculate the relationship between moment and curvature under various axial loads: assuming plane sections remain plane, the distribution of stress across the section for a given curvature and neutral axis position can be determined; integration of stresses then gives the corresponding axial force and moment. If this is repeated for a variety of curvatures and neutral axis positions, the relationship between curvature (1/R) and moment (M) may be established for various values of direct load (P). This relationship can then be plotted for (0.1, 0.2, 0.3, ..., 1.0) times the maximum axial load P0. in the conventional fashion [4].
6. If we assume that the curvature of a pin-
e2/h = (1/π²)(h/R)(L/h)² (2)
where e2 is the displacement, L is the length and R is the radius of curvature. This relationship can be plotted fo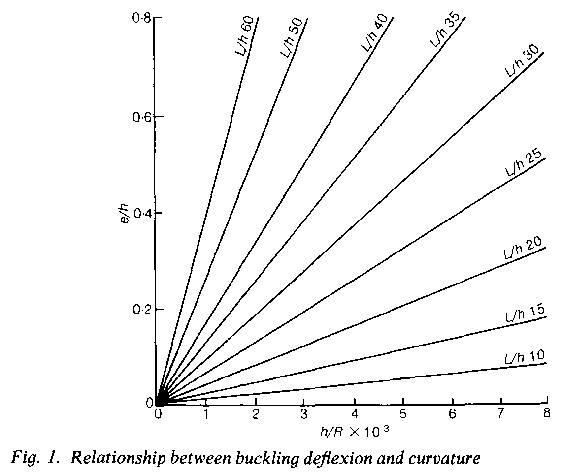 r various column lengths (Fig. 1).
7. By comparing the moment P.e2 with the moment resistance at various values of curvature and axial load, the maximum load for which equilibrium is possible can be found by trial and error. However, this is time-
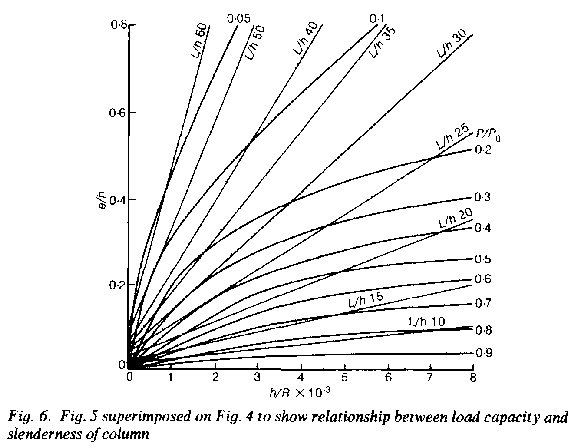
8. At equilibrium, the load eccentricity must equal the column's displacement; if a line relating curvature to displacement is superimposed on Fig. 2, the maximum load for which equilibrium may be attained can be read off directly (Fig. 4). If an initial eccentricity e, is present this can he incorporated by displacing A to B, with failure occurring at total eccentricity e = e1 + e2.
9. For greatest convenience, curvature-
10. Where moments are applied to a column, these may give an initial deflexion somewhat different from that calculated by equation (2), which corresponds with a sine-
11. For interest, a solution for steel stanchions of grade 43 steel (Ys = 255 N/mm²), based on elastic theory and the BS449 assumed imperfections, is shown in Fig. 8. For comparison, Table 1 gives the results from Table 17(a) of BS449, referred to Ys/1.7 = 150N/mm².

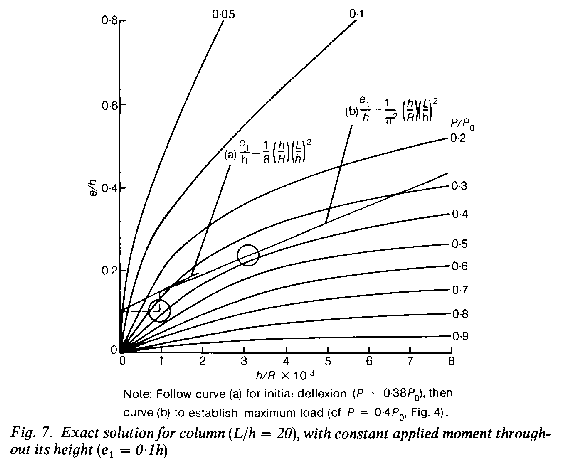

Note: Follow curve (a) for initial deflexion (P = 0.38P0), then curve (b) to establish maximum load (cf. P = 0.4P0, Fig. 4).
12. Although this method of analysis is relatively simple (the major labour is in the preparation of the load eccentricity-
Slender reinforced concrete columns -
13. The behaviour of reinforced concrete is complex -
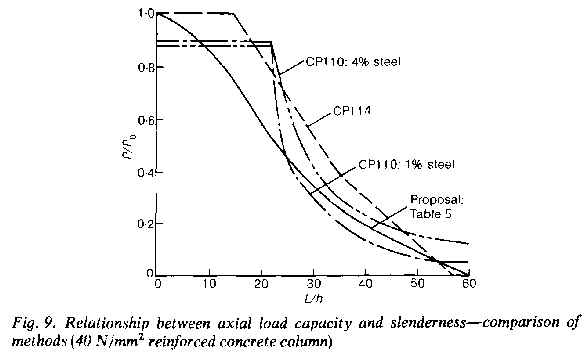
14. CP110 (Clause 3.5.7) takes a different approach. Rather than reducing column capacity with slenderness, it defines an additional moment to be applied in ultimate section design to cover the effects of buckling. The recommendations are based on theoretical work and comparison with experimental results and their development has been described by Cranston [9]. For interest, axially loaded column capacities according to the various recommendations are compared in Fig. 9 for a 40N/mm² rectangular column with 1% or 4% high-
15. Table 18 of CP114 is open to criticism for its vintage and lack of defined theoretical basis. However, CP110’s recommendations are also open to criticism: calculations based on the ultimate moment resistance of a cracked section cannot be directly related to the instability failure of a slender column which, as is clear from equation (1), depends on stiffness rather than strength. In particular, the CP110 recommendations predict that an increase in reinforcement will lead to a disproportionate increase in carrying capacity for slender columns, and that buckling effects are minimal until L/h values of well over 20 are attained. Both of these seem dubious when basic buckling considerations and the behaviour of other elements, such as steel stanchions, arc considered.
16. In Cranston’s report, the CP110 method is compared with a large number of experimental results. The ratios of test load/predicted load for short-
Analysis of slender reinforced concrete columns
17. For this Paper, the capacities of rectangular columns with reinforcement at 0.2h and 0.8h have been calculated by the method set out earlier. This has been done for 20 N/mm² and 40 N/mm² concrete, each with either 0.8% or 4% of high-
18. While short-
19. The question of initial eccentricity due to the column being bowed or out of plumb is similarly difficult: not only are there concrete tolerances but the reinforcement can also be misplaced. Published data on this appear to be scant -
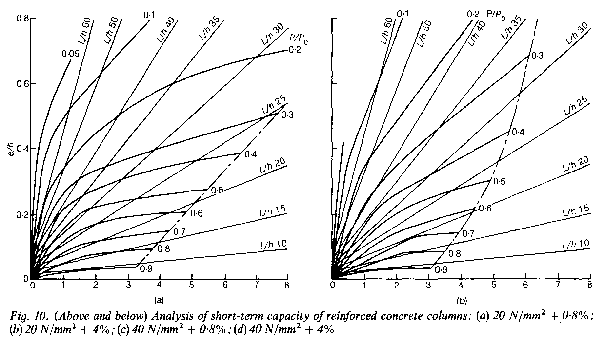


20. For practical reasons, the section analyses were done by dividing the section at intervals of 0.2h, determining the stresses at these points and integrating these stresses (by trapezoidal rule) to calculate the force and moment corresponding to a given curvature. Points in between the calculated values were obtained by interpolation. Thus it should be noted that the curves are to some extent approximate and that a more precise analysis might alter the results slightly.
21. The calculated reductions in column capacities resulting from the effects of slenderness are given in Table 2.
Reinforced concrete columns with bending
22. Both CP114 and CP110 assume that the allowance for slenderness does not need to be altered when the applied load is eccentric. However, calculations suggest that this is not so: as illustrated in Table 3, slenderness affects these columns more seriously than axially loaded ones.
23. At first sight, these figures are worrying, suggesting that present methods might be unsafe; however, the real circumstances which give rise to column moments must be considered.
Braced frame, where beam bending causes column moments
24. In this situation, maximum moments usually occur at the column ends, with much lower moments at mid-
Unbraced frame subjected to temporary sway loads
25. Sway loads are normally short term -
Eccentrically loaded cantilever column or sway frame with long-
26. None of the relieving factors listed in §§21 and 22 applies here, so there must be some concern that CP114 and CP110 could be unsafe in these situations.
Comparison with tests
27. Reinforced concrete column capacities calculated by the method outlined have not been verified by a programme of tests. However, comparison of the test results listed by Cranston (biaxial bending and those outside the range of the prepared graphs were omitted) with the theoretical capacities (based on d = 0.8h, fy = 425 N/mm², without correction for differences in effective depth or steel strength) gave a range, mean and coefficient of variation of 0.78-
Approximate method for design
28. Although the determination of column strength from load eccentricity -
29. Where moments are present the situation is more awkward but, as already established, in most practical situations the application of the basic reduction factor to both axial load and moment should give reasonable results, and in braced columns the CP114 suggestion that sections less than one-
30. Trial calculations suggest that reasonable answers can be obtained in this situation if the eccentricity of the applied load is increased by eadd where
eadd = 0 at L/h = 0
eadd = (Pcc/Po).e1 ≤ 0.25h at L/h ≥ 15;
Po is the axial load capacity of the section and Pcc is the axial load capacity of the concrete acting alone. For values of between 0 and 15, values may be interpolated. Values of P/Pe for eccentricity e1 = 0.3 recalculated in this manner are given in Table 4 and it can be seen that reasonable agreement with Table 3 has been obtained.
31. The long-
Reinforced concrete columns: safety factors
32. Although the principles for practical design of slender reinforced concrete columns have been established, the values of factors to be used depend on the way safety factors are applied. This is a highly controversial matter at present, with two contending approaches -
33. CP114 requires a safety factor of 1.8 against failure, with concrete in the structure assumed to have 75% of the strength of test cubes. This reflects the less favourable placing, compacting and curing conditions for the concrete in a structure. A value of 75% appears to be a reasonable estimate of the strength difference between air-
34. CP110 divides the factor of safety into two partial factors, one applied to loads and the other to materials. The overall load factor depends on the ratio of dead to live load, varying between 1.4 and 1.6; as concrete columns usually carry mainly dead load, their overall load factor is typically about 1.45. The materials factor for concrete is 1.5 but no separate allowance is made for the reduced strength of concrete in the structure noted above; if this is taken as 75%, then the effective safety factor on concrete is similar to that on steel, 1.15. This implies that the overall safety factor is usually about 1.65.
35. When applied to slender columns, further differences emerge: the capacity of a slender column is proportional to stiffness, rather than strength. There is no difficulty with CP114 -
36. For this reason, design proposals derived in accordance with CP110’s principles will not be presented here. Instead, the principles of CP114 have been followed in deriving design rules, as there seems little doubt regarding their acceptability. However, there should be no objection to using the resulting rules in CP110 designs.
Proposed design rules for reinforced concrete columns
37. These are based on the following assumptions:
(a) a constant safety factor is used for all slenderness ratios
(b) concrete in a real structure has 75% of the specified cube strength
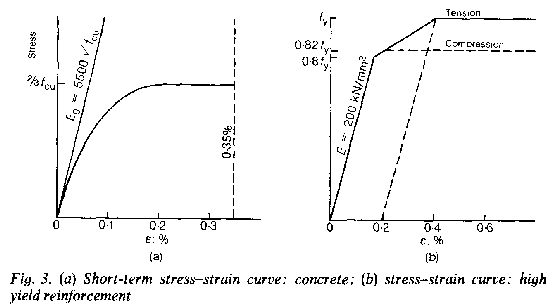
(c) the concrete has a parabolic stress-
(d) the reinforcement is high yield, with a stress-
(e) the column follows a sinusoidal curve as it buckles
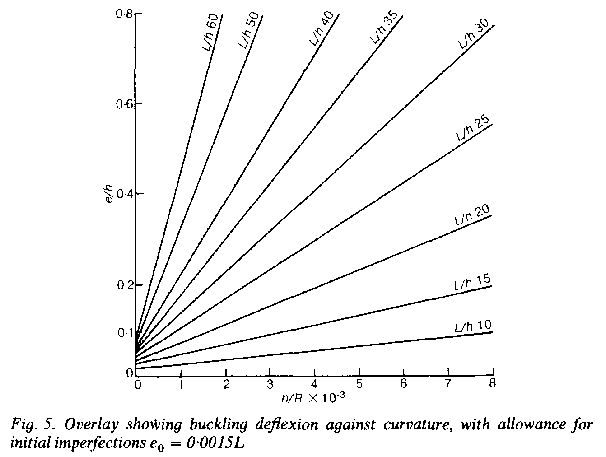
(f) initial imperfections are equivalent to a bow of 0.0015L.
38. Although coefficients have been calculated for L/h up to 60 (slenderness ratio 207), columns as slender as this are very vulnerable to differential temperature, shrinkage, construction tolerances and accidental damage. Because of this, the coefficients for normal use have been tapered out to zero at an L/h value of 60. The concrete strengths of 20 N/mm² and 40 N/mm² in the initial analysis correspond to design cube strengths of 27 N/mm² and 53 N/mm² respectively (see (b) of §37). Reduction factors based on these have been calculated for design cube strengths of 25 N/mm² and 50 N/mm² and these are given in Table 5. For interest, the values for 40 N/mm² columns are plotted against those from CP110 and CP114 on Fig. 9.
39. These coefficients may also be used for eccentrically loaded columns in the normal fashion, except in the case of unbraced columns where the maximum moments generated by sustained loads occur in the same regions as those due to buckling. Examples of the latter are cantilever columns subjected to sustained moments or sway frames subjected to sustained lateral loads.
40. In these situations, either a rigorous analysis should be adopted or the load eccentricity should be increased by eadd, where
eadd = (Pcc/P0).e1 ≤ 0.25h for L/h = 15
eadd = 0 for Llh = 0
Pcc and Po are the short column axial load capacity of the concrete alone and of the reinforced section respectively. Intermediate values may be interpolated.
Conclusions
41. A graphical method has been outlined which gives quick and accurate solutions for the capacities of columns over a wide range of slenderness and load eccentricities. The method allows the capacities of columns of non-
42. The application of the method to reinforced concrete columns allows design rules to be established which have a clear basis in theory, and the results obtained suggest that the use of simple capacity reduction factors (similar to those in CP114) is the most suitable presentation for normal use. Comparison with test results shows that, although the method is simple, it is considerably more accurate than CP110 or CP114. An additional-
Further work
43. If the method presented here is accepted as useful, it should assist in the theoretical examination of various types of compression members. The following areas of work are suggested :
(a) confirming the properties of reinforced concrete sections other than the simple one analysed here -
(b) analysis of plain and lightly reinforced concrete sections such as walls;
(c) brickwork and blockwork walls.
44. It would be of considerable assistance if more definite information could be obtained on the size of initial imperfections which occur in properly built columns and walls in practice, so that these could be allowed for with more confidence.
Acknowledgements
45. Thanks are due to the following for their comments and assistance: W. B. Cranston, D. C. C. Davis, R. G. Drysdale, M. E. R. Little, A. A. Park, P. E. Regan, W. E. A. Skinner, F. G. Thomas, C. B. Wilby and J. A. Smith.
References
1. EULER L, Sur la force des colonnes. Memoires de l’Academie de Berlin 1759 (transl. van den Broek, J. A., Euler’s classic paper ‘On the strength of columns’, Am. J. Phys., July-
2. GODFREY G. B., The allowable stresses in axially-
3. BRITISH STANDARDS INSTITUTION, The use of structural steel in building: Part 2. BSI, London, 1969, BS 449.
4. CEB-
5. BRITISH STANDARDS INSTITUTION, The structural use of reinforced concrete in buildings, BSI, London, 1969, CP 114.
6. BRITISH STANDARDS INSTITUTION, The structural use of concrete, BSI, London, 1972, CP 110, Part 1.
7. Report of the Reinforced Concrete Structures Committee of the Building Research Board, with recommendations for a code of practice for the use of reinforced concrete in building. HMSO. London, 1933.
8. THOMAS F. G., Studies in reinforced concrete: VII -
9. CRANSTON W. B., Analysis and design of reinforced concrete columns, Cement and Concrete Association, London, 1972, Research Report 20.
10. FABER J. and MEAD M., Faber’s reinforced concrete, Spon, London, 1961.
11. CEMENT AND CONCRETE ASSOCIATION, Handbook On the Unified Code for Structural Concrete (CP110: 1972), Cement and Concrete Association, London, 1972.
12. REDEKOP D., Study of reinforced concrete columns in existing buildings, MEng thesis, McMaster University, Ontario, 1971.
13. PLOWMAN J. M. et al., Cores, cubes and the specified strength of concrete, Struct. Engr, 1974, 52, Nov., No. 11.
|
L/r |
25 |
50 |
75 |
100 |
125 |
150 |
175 |
200 |
|
P/Po |
0.97 |
0.89 |
0.73 |
0.53 |
0.37 |
0.27 |
0.2 |
0.16 |
Table 1. Results taken from Table 17(a) of BS449
|
Concrete |
|
|
|
|
L/h |
|
|
|
|
|
|
grade N/mm² |
Reinforcement |
10 |
15 |
20 |
25 |
30 |
35 |
40 |
50 |
60 |
|
Short 20 |
0.8% |
0.89 |
0.83 |
0.74 |
0.64 |
0.55 |
0.46 |
0.39 |
0.27 |
0.19 |
|
term 20 |
4% |
0.89 |
0.81 |
0.7 |
0.58 |
0.48 |
0.38 |
0.31 |
0.22 |
0.16 |
|
40 |
0.8% |
0.9 |
0.83 |
0.73 |
0.62 |
0.5 |
0.4 |
0.32 |
0.21 |
0.14 |
|
40 |
4% |
0.91 |
0.8 |
0.7 |
0.58 |
0.48 |
0.38 |
0.29 |
0.19 |
0.13 |
|
Long 20 |
0.8% |
0.89 |
0.79 |
0.65 |
0.5 |
0.39 |
0.3 |
0.23 |
0.14 |
0.09 |
|
term 20 |
4% |
0.9 |
0.81 |
0.68 |
0.53 |
0.42 |
0.3 |
0.23 |
0.14 |
0.1 |
|
40 |
0.8% |
0.85 |
0.71 |
0.56 |
0.4 |
0.3 |
0.23 |
0.17 |
0.1 |
0.07 |
|
40 |
4% |
0.86 |
0.73 |
0.6 |
0.46 |
0.34 |
0.25 |
0.19 |
0.11 |
0.08 |
Table 2.
Ratio P/P0 for columns with high-
|
Concrete |
|
|
|
|
L/h |
|
|
|
|
|
|
grade N/mm² |
Reinforcement |
10 |
15 |
20 |
25 |
30 |
35 |
40 |
50 |
60 |
|
Long 20 |
0.8% |
0.69 |
0.44 |
0.35 |
0.3 |
0.25 |
0.21 |
0.17 |
0.11 |
0.06 |
|
term 20 |
4% |
0.82 |
0.69 |
0.53 |
0.43 |
0.33 |
0.23 |
0.16 |
0.12 |
0.08 |
|
40 |
0.8% |
0.57 |
0.39 |
0.33 |
0.26 |
0.2 |
0.15 |
0.11 |
0.07 |
0.04 |
|
40 |
4% |
0.8 |
0.65 |
0.49 |
0.35 |
0.29 |
0.22 |
0.18 |
0.12 |
0.06 |
Table 3. Ratio P/Pe for load applied at eccentricity e1 = 0.3h
(Pe is short column strength for e1 = 0.3h)
|
|
|
|
|
L/h |
|
|
|
|
|
|
|
|
|
10 |
15 |
20 |
25 |
30 |
35 |
40 |
50 |
60 |
|
20N/mm² |
0.8% |
0.64 |
0.48 |
0.4 |
0.31 |
0.24 |
0.18 |
0.14 |
0.09 |
0.06 |
|
20N/mm² |
4% |
0.76 |
0.65 |
0.54 |
0.42 |
0.34 |
0.24 |
0.18 |
0.11 |
0.08 |
|
40N/mm² |
0.8% |
0.53 |
0.35 |
0.28 |
0.21 |
0.16 |
0.12 |
0.08 |
0.05 |
0.04 |
|
40N/mm² |
4% |
0.6 |
0.54 |
0.44 |
0.34 |
0.26 |
0.19 |
0.14 |
0.09 |
0.06 |
Table 4. Ratio P/Pe for load applied at e1 = 0.3h, approximate method
|
L/h |
L/ryy |
25N/mm² |
50N/mm² |
|
5 |
17 |
0.95 |
0.95 |
|
10 |
34 |
0.88 |
0.85 |
|
15 |
52 |
0.8 |
0.71 |
|
20 |
69 |
0.66 |
0.56 |
|
25 |
86 |
0.52 |
0.43 |
|
30 |
104 |
0.41 |
0.32 |
|
35 |
121 |
0.3 |
0.23 |
|
40 |
138 |
0.23 |
0.18 |
|
50 |
172 |
0.12 |
0.09 |
|
60 |
207 |
0 |
0 |
Table 5. Proposed capacity reduction factors for design of slender reinforced concrete columns
This paper is reproduced by kind permission of the Institution of Civil Engineers www.icevirtuallibrary.com
