

Alasdair’s Engineering Pages © A. N. Beal 2024 www.anbeal.co.uk


www.anbeal.co.uk


Proc. Inst. Civ. Engrs, Part 2, 1981, 71, Dec., 1037-
8494 Concrete cube strengths -
A. N. Beal, BSc, Engineer, R. H. Thomason & Partners
The idea of specifying a ‘characteristic strength’ defined by a maximum of 5% defective material, proposed in CP 110, has been accepted in BS 5328 and is now being adopted for other materials. On investigation it is found that in addition to being awkward to apply in practice the CP 110 and BS 5328 definitions are very vague and there are serious conflicts between them and the proposed compliance criteria. The important distinction between ‘within-
Introduction
Work done in the 1960s and 1970s has resulted in great changes in the way the strength of building materials is specified and also in changes in how compliance with the specification is assessed. In the new specifications, the idea that acceptance should depend on evidence that the strength exceeds some specified minimum strength has been replaced by a definition based on statistical concepts. The terms ‘minimum strength’ and ‘guaranteed yield stress’ have been replaced by ‘characteristic strength’.
2. It is accepted now that some defective material will be supplied and the limit is not on minimum strength but on the maximum acceptable proportion of defective material. The discussion in this Paper concerns the specification of concrete crushing strength.
General comments
3. The statistical approach was introduced in CP 114 [1] for testing designed mixes and it was developed further in CP 1102 and BS 5328. While CP 114 works to a limit equivalent to 2¼% defectives, a limit of 5% defectives has been adopted as standard in CP 110, BS 5328 and other recent specifications.
4. Although statistically-
5. While many engineers may sympathize with these opinions a more detailed investigation is necessary to establish clearly the rights and wrongs of the case.
Probability theory
6. The probability theory commonly applied assumes that variations in concrete strength occur completely at random within a stable, theoretically infinite population, and that possible variations are infinite in number. In this model individual test results can only be indicators of the overall variation and, as several writers have stressed, any conclusions reached can apply only to the population as a whole, based on the calculated overall proportion of defectives. As any variations within the concrete are completely random and unpredictable, only the whole of the concrete can be judged to be ‘good’ or ‘bad’.
7. When the decision on acceptance or rejection is made some confusion may be caused by the fact up to 5% of the ‘good’ concrete may be defective and up to 94% of the ‘bad’ concrete may be completely satisfactory. In the latter case there will always be a temptation to try to locate and condemn only the defective 6% but this cannot be done if the variations are completely random. The question of whether there are patterns within random events is a fascinating one (see references 4 and 5) but is probably outside the scope of this discussion.
Within-
8. The analysis assumes that in any job, no matter how big or small, the variation of strength is a continuum with infinite local variations -
9. This is almost certainly wrong. There is good reason to believe that within-
10. This point seems to be fairly obvious and it is surely fundamental to a proper consideration of concrete strength variation and quality control. What is surprising is that, despite the amount of research and writing there has been about concrete strength and statistics, the published information available in Britain on within-
11. Despite this lack of information about the actual extent of within-
12. For concrete quality control, provided mixing is done properly, within-
Small number probability theory
13. The statistical theory normally used for concrete quality control calculations is that based on large numbers -
14. For smaller jobs the idea of an estimated ‘percentage defective’ can be rather academic too. If 100 loads of concrete are ordered and the supplier is producing 2% defectives on average, then this suggests there should be 2 below-
15. The probability Pd of d defectives being delivered in T batches, if they are drawn from an infinite population with an overall proportion of p% defectives, can be calculated from the formula
Pd = T!(1 -
If p = 2%, then in one hundred batches there is a 13% chance of receiving no defectives at all (0%) and a 14% chance of 4 or more (4%). It will be a matter of purely academic interest to the customer to estimate from the mean and standard deviation that the producer is producing an average of 2% defectives if none of them is actually delivered to his/her site; conversely it would be small comfort to estimate an average of 2% defectives if four or more bad loads arrive in a hundred.
16. Calculations based on the mean and standard deviation will tend to indicate the overall average proportion of defectives that the supplier is producing. While this may well be important to the supplier, for the engineer it is the number which arrive on the site that he or she is concerned with which matters. On small and medium-
17. If probability curves are not followed, it is still difficult to establish the true percentage of defectives. Keene [8] has shown that with the numbers of test results available on many jobs it is not possible to establish the actual proportion of defectives with sufficient accuracy for this to be a practical parameter for judging the quality of concrete.
Compliance criteria
18. One feature that should be displayed by any compliance scheme which is rational is consistency in its verdicts. In other words it should never happen that concrete which arrives on one day and is judged satisfactory might have been judged unsatisfactory had it arrived on another day. When assessment is based on groups of results the problem is that concrete can suffer guilt by association -
CP 110 and BS 5328: characteristic strength definition
19. CP 110 Cl. 6.8.2.1 reads as follows:
‘General. The characteristic strength is that 28 day cube strength below which not more than 5% of the test results may be expected to fall.’
20. BS 5328 Cl. 3.4 reads as follows:
‘Characteristic strength. That value of strength below which 5% of the population of all possible strength measurements of the specified concrete are expected to fall.’
21. It must be admitted that these are rather difficult definitions with which to establish compliance -
22. Following the specification precisely, there is no point in trying to establish the actual proportion of defective material -
23. Some will argue that the normal (Gaussian) statistical distribution must be used to calculate what ‘may be expected’ but neither specification actually requires this. Although the normal distribution has been found to agree reasonably closely with the variation of strength commonly found there is nothing to stop a rogue result falling well outside the curve.
24. Even if it was required that results should adhere strictly to this curve, the engineer would still have to accept that it would allow 1 result in 740 to fail by 1.36 times the standard deviation. (The 5% limit corresponds to 1.64 times the standard deviation below the mean; 1 in 740 is obtained at 3 times the standard deviation below the mean.) Thus if the standard deviation was 7.5 N/mm² and the design characteristic strength was 30 N/mm², a result of 20 N/mm² should be expected (and accepted) once in 740 loads.
CP 110 and BS 5328: test acceptance criteria
25. CP 110 Cl. 6.8.2.2 reads:
‘ ... Compliance with the specified characteristic strength may be assumed if ...’ before setting out standards for accepting cube results: the mean of any set of four consecutive results should exceed the characteristic strength by at least 0.82 times the standard deviation and each individual result should exceed 85% of the specified characteristic strength.
26. BS 5328 Cl. 16.2.1 reads:
‘Where compressive strength is specified:
Compliance with the characteristic strength shall be assumed if the conditions given in both (a) and (b) are met. . .’. Conditions (a) and (b) state that, for concrete strengths over 20 N/mm², the mean of four test results should exceed the specified characteristic strength by at least 3 N/mm² and no individual result should fall more than 3 N/mm² below it.
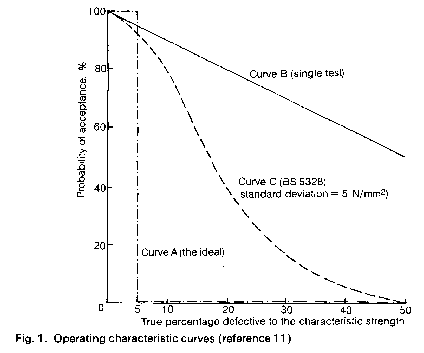
27. Considerable work has been done on calculating the risk to the producer of ‘good’ concrete being rejected and the risk to the consumer of ‘bad’ concrete being accepted under various testing schemes, with the results being presented as an operating characteristic (O/C) curve for each testing scheme. (See Metcalf [9] and BRE Digest [10].) The ideal O/C curve is supposed to be that which is certain to accept concrete which is less than 5% defective and certain to reject concrete which is more than 5% defective. The Author is of the opinion that Metcalf misrepresents several of the specifications he analyses but, apart from this, it is clear that none succeeds in achieving the ideal O/C curve. In particular, the customer’s risk of accepting bad concrete is often substantial. The O/C curve for the BS 5328 criteria published in BRE Digest 244 [11] (reproduced here as Fig. 1) suggests that the customer has a 20% chance of accepting concrete which is 30% defective. The link with a strict ‘5% defective’ criterion seems very tenuous and it is hard to see how the CP 110 and BS 5328 acceptance criteria, with their quite different requirements, can both be said to correspond to an identical strength definition. Maybe the idea that these acceptance criteria establish a true ‘5% defective’ test is nearer to wishful thinking than established fact. If so, it would be as well as if those who are trying to define structural design as a whole in probability terms were aware of this.
Conflicts between the characteristic strength definition and the compliance criteria in CP 110 and BS 5328
28. While the publications referred to [9, 10] discuss the balance of risks between the supplier and the customer for each test scheme considered, neither addresses the problems which arise if there is a straightforward contradiction between the characteristic strength definition and the specified testing plan. In CP 110 and BS 5328 the clauses which follow the basic definition are only suggested schemes for testing compliance. Material which fails to comply with the acceptance criteria may still have to be accepted if it can be shown not to conflict with the basic definition of characteristic strength.
29. The testing plans in CP 110 and in BS 5328 both impose an absolute limit on minimum strength, yet the basic strength definitions contain no such limit. The unscrupulous supplier could argue that he is bound by neither a minimum strength requirement nor even by the limits of the normal distribution, provided that he can show (or expect) that less than 5% of the test results are defective. Even if the engineer found this argument completely unacceptable the supplier would be on quite strong ground on legal terms.
30. The limits on ‘means of four’ are central to the requirements of CP 110 and BS 5328, yet they are probably the most frequently ignored by both suppliers and customers. Both specifications state that any group which fails to meet these limits should be rejected -
31. These conflicts between the specification and the test requirements and the illogical positions the engineer can be forced into pose a serious problem because the specification is the document referred to in times of dispute; if it has clear logical weaknesses and internal contradictions it may well prove worse than useless.
CP114
32. While CP 114 is still widely used for design purposes its specification for the strength of designed concrete mixes (Cl. 209c) is not so popular. No doubt this is because of the distinctly odd results it can give in practice. It works to a rather higher standard than CP 110 and BS 5328 -
33. This specification is not vague and ambiguous (unlike CP 110 and BS 5328) -
34. However, when this specification is viewed from a practical, rather than a theoretical, point of view its drawbacks become clear. The limits on range for the sets of four mean that, in the first 40 results, concrete may be rejected because of an individual result which is too high, as well as one which is too low. After the first 40 results concrete may be accepted initially and then later rejected because it falls among the 40 consecutive results considered with a later bad result. Its status is not clear until 39 subsequent results have been checked. If the time taken for 40 test cubes to be accumulated is added to the 28 days it takes before the concrete is tested, it may be months before concrete is finally passed or failed. There is also no firm limit placed on the minimum strength of an individual test result (§ 24).
What is the alternative?
35. It is clear that a specification based on ‘characteristic strength’ suffers from many disadvantages. The simple requirement ‘no test result shall fall below the specified minimum strength’ does not suffer from any of these. If each batch is tested then its strength is known to within the limits of within-
36. Thus the key elements of the specification are
(1) the required minimum strength
(2) the required testing rate
The higher the testing rate, the better the guarantee of concrete quality. Although many builders will prefer not to have too many test cubes to make they will still not want the testing rate to fall too low, because too much concrete could be risked on one decision.
37. Although this requirement is stricter than the ‘characteristic strength’ ones at no stage can it be said to be unfair to the supplier -
38. There seems to be no reason why this requirement should be unacceptable to suppliers -
Relating customer’s risk to sampling rate
39. Anyone reading either of the publications referred to which deal with the customers’ risk under various sampling schemes [9, 10] will notice that one of the first operating characteristic curves presented (curve B, Fig. 1) is supposed to represent the criterion ‘no test result shall fall below the specified minimum strength’. It would appear on this showing to be a poor criterion -
40. It is here that a useful role for probability theory emerges: it allows us to calculate the consumer’s risk of accepting defective concrete for various sampling rates and may help in the selection of suitable values for these. According to ‘large number’ probability theory the probability P of f defectives being detected in N tests where there is a total of d defectives in T batches, may be calculated from the formula
P = (N!/(f!(N -
The formula
P = (N(d/T))f /((exp N(d/T))f!) (3)
gives a close approximation where N is large and d/T is small and is the formula which has been used in calculating the published O/C curves [9].
41. If there are 20 batches and 1 batch is defective (5% defectives), then equation (3) predicts a 30% chance of detecting the defective one when ten samples are taken and a 37% chance when 20 samples are taken. However, common sense suggests that when the sampling rate is one in two there must be a 50% chance of detecting the defective one; when a sample is taken from every batch there must be a 100% chance of detecting the defective one. Clearly something is wrong -
42. What we need to know is this; if all the test results exceed the specified minimum strength, what is the probability that there are actually (1, 2, 3, ...) defectives present? This can be calculated from the true formula
P = ((T -
43. For a given rate of sampling, the chance of a set number of defectives being present works out to be almost constant for all numbers of batches above about 20. The number of defectives guaranteed to various degrees of certainty for various sampling rates are shown in Table 1. If we want at least 50% certainty that a given proportion of defectives will not be exceeded, the numbers of batches for which a given sampling rate is appropriate are shown in Table 2.
44. We could now proceed to define, say, 2.5% defectives as a suitable value for high quality concrete and read off the sampling rate appropriate to the number of batches of concrete involved. However, although the general trend of the figures looks reasonable it is clear that they could not be used as a strict ruling. For no more than 2.5% defectives in 39 batches a sampling rate of 1 in 1 would be necessary -
45. No doubt some mathematical ‘fudge’ could be devised to clear this anomaly in some way but could it provide the definitive answer? Perhaps it is better to set the calculations aside at this point for there are other issues to consider; as they stand the figures provide some useful quantitative information about the relationship between sampling rate and the guarantee of strength obtained.
46. All this is based on the assumption that no test fails. What happens if one does? The chain of satisfactory results is then broken and the calculated guarantee of strength no longer holds. Unless the engineer has great faith in the concrete supplier, the rate set must clearly be sufficient to maintain an adequate guarantee of the concrete which remains when defective material has been detected and rejected. Secondly, if defective concrete is being supplied, it is helpful if the sampling rate is sufficient to identify and eliminate a useful proportion of it. In the circumstances, selection of the sampling rate is really a calculated gamble. CP 110 suggests (Table 51) a range of sampling rates from 1 in 10 m³ to 1 in 50 m³ and its advice on using them is sound: ‘... Higher rates of sampling and testing would be appropriate at the start of the work, to establish the level of quality quickly, or during periods when the quality is in doubt. Conversely, rates may well be reduced when high quality has been established.’
Conclusions
47. A specification based on the idea of ‘characteristic strength’ seems to have disadvantages in almost every area
(a) the basic definition of ‘characteristic strength’ in CP 110 and BS 5328 is hopelessly vague, dealing in expectations rather than verifiable facts;
(b) the definition sets no limit to the lowest strength of concrete which may be accepted;
(c) because the definition relates only to the concrete supplied as a whole, it requires the engineer to accept or reject all the concrete, good and bad. Such an apparently unreasonable decision must tend to undermine the engineer’s authority;
(d) the important distinction between ‘within-
(e) estimates of the percentage defective calculated from statistical parameters will tend to indicate the average proportion the supplier is producing. Because of (d) the percentage actually supplied on small and medium sized jobs can differ greatly from this figure;
(f) with normal rates of testing it is not possible to estimate the actual proportion of defectives on small and medium sized jobs with sufficient accuracy for this to constitute a satisfactory parameter for defining strength. If every batch was tested the true proportion would be known but then a probabilistic treatment would seem pointless;
(g) the published ‘operating characteristic’ curves for the CP 110 and BS 5328 compliance criteria show only a slight resemblance to a strict definition of a defectives level. In particular the risk to the consumer of accepting bad concrete is often substantial;
(h) there are serious contradictions between the definitions of characteristic strength in CP 110 and BS 5328 and their respective compliance criteria;
(i) the limits on ‘means of four’ can give rise to illogical decisions in certain circumstances;
(j) the strength definitions and compliance criteria in CP 110 and BS 5328 combine to produce specifications which are vague, illogical and self-
(k) the strength specification in CP 114 does not have the vagueness and internal contradiction of those in CP 110 and BS 5328. It does, however, suffer from the other weaknesses of ‘characteristic strength’ definitions and is impractical to use;
(l) a simple ‘minimum strength’ requirement avoids the problems outlined. Published analyses have seriously misrepresented this criterion; it can be shown that its performance in statistical terms is much better than has been suggested;
(m) published ‘operating characteristic’ curves are based on a probability equation which is only accurate at very low sampling rates (1 in 10 and below) and are thus not accurate for normal circumstances. This arises because of conclusion (d). The correct equation has been presented here and used in the calculations for the ‘minimum strength’ criterion;
(n) although statistical calculations can aid selection of a suitable sampling rate, they cannot define it absolutely -
(o) specifications based on ‘characteristic strength’ are neither practical nor useful and should be replaced by simple ‘minimum strength’ requirements;
(p) while a case might be made for an increase in permissible stresses if this is done, it might be better to wait until more information on within-
Acknowledgements
Thanks are due to the Cement and Concrete Association, the Building Research Station and the Transport and Road Research Laboratory for their co-
Appendix
49. Some of the arguments in this Paper will apply to statistically-
50. However, this Paper’s argument does not generally apply to the statistical treatment of timber strength adopted in CP 112. From the account of its derivation given in the Timber Designers’ Manual [14], it is clear that its approach to statistics and the use to which it puts them are quite different.
51. If the ‘characteristic strength’ definition is abandoned, it is to be hoped that other Code clauses can be tidied up as well e.g. CP 110 Cl. 6.8.5.: ‘... The water/cement ratio of a batch of concrete shall not exceed the specified maximum value by more than 5% of that value ...’. While the value to concrete specification of such clauses is open to doubt, there is no doubt at all about the damage they do to our language.
References
1. British Standards Institution, CP 114: The structural use of reinforced concrete in buildings, BSI, London, 1969.
2. British Standards Institution, CP 110 Part 1: The structural use of concrete, BSI, London, 1972.
3. British Standards Institution, BS 5328: Methods for specifying concrete, BSI, London, 1976.
4. Koestler A., The roots of coincidence, Hutchinson, London, 1972.
5. Hardy A. et al, The challenge of chance, Hutchinson, London, 1973.
6. Metcalf, J. B., The specification of concrete strength Part 2: The distribution of strength of concrete for structures in current practice, RRL Report LR 300, Ministry of Transport, 1970.
7. Private communication, 16 December 1980.
8. Keene P. W., ‘The 5 percent failure level in practice’, Concrete, March 1980, The Concrete Society, London.
9. Metcalf J. B. ‘The specification of concrete strength. Part 1: The statistical implications of some current specifications and codes of practice’, RRL Report LR 299, Ministry of Transport, 1970.
10. Building Research Establishment, Digest 244. Concrete mixes : specification, design and quality control. Department of the Environment, 1980.
11. Building Research Establishment, Digest 244. Concrete mixes : specification, design and quality control. Department of the Environment, 1980. p. 7, Fig. 4.
12. British Standards Institution, BS 4449: Hot rolled steel bars for the reinforcement of concrete. BSI, London, 1978.
13. British Standards Institution, BS 4461: Cold worked steel bars for the reinforcement of concrete. BSI, London, 1978.
14. Ozelton E. C. and Baird J. A. Timber Designers’ Manual. Crosby Lockwood Staples, London, 1976.
Proc. Instn Civ. Engrs, Part 2, 1982, 73, June, 515-
Concrete cube strengths -
A. N. BEAL
111. One error in the Paper has been identified by Baker and Manners, and Sym. It concerns the interpretation of equation (4) in the Paper and this requires correction. §42 and §43 should be revised to read
42. What we need to know is this: what is the probability that all test results will exceed the specified minimum strength if there are actually (1, 2, 3, ...) defectives present? This can be calculated from the true formula
P = ((T -
For a given rate of sampling, the chance of a set number of defectives avoiding detection works out to be almost constant for all numbers of batches above about 20. For a given degree of certainty that there would be test failures if they were exceeded, the maximum numbers of defectives which could be present at various sampling rates are shown in Table 1. If we want at least 50% certainty that test failures would result if a given proportion of defectives was exceeded, the numbers of batches for which a given sampling rate is appropriate are shown in Table 2.
|
Table 1 |
Number of batches |
guaranteed by various |
sampling rates |
|
|
|
Degree of certainty |
|
|
Sample rate |
≥50% |
≥75% |
≥90% |
|
1/2 |
≤1 |
≤2 |
≤4 |
|
1/3 |
≤2 |
≤4 |
≤6 |
|
1/4 |
≤3 |
≤5 |
≤8 |
|
1/5 |
≤4 |
≤7 |
≤11 |
|
1/10 |
≤7 |
≤14 |
≤22 |
|
|
|
|
Sample rate |
|
|
|
|
% defective |
1/1 |
1/2 |
1/3 |
1/4 |
1/5 |
1/10 |
|
2.5 |
0 - |
40 - |
80 - |
120 - |
160 - |
≥280 |
|
5 |
0 - |
20 - |
40 - |
60 - |
80 - |
≥140 |
|
10 |
0 - |
10 - |
20 - |
30 - |
40 - |
≥70 |
Table 2. Numbers of batches for which sampling rates give 50% certainty that test failures will occur if proportions defective are exceeded
|
|
|
Sampling |
rate |
|
|
|
% defective |
1/2 |
1/3 |
1/4 |
1/5 |
1/10 |
|
2.5 |
0 - |
40 - |
80 - |
120 - |
≥240 |
|
5 |
0 - |
20 - |
40 - |
60 - |
≥120 |
|
10 |
0 - |
10 - |
20 - |
30 - |
≥60 |
Table 2 (revised)
Numbers of batches for which sampling rates give 50% certainty that test failures will occur if proportions defective are exceeded
|
|
Degree |
of certainty |
|
|
Sampling rate |
≥50% |
≥75% |
≥90% |
|
1/2 |
0 |
≤1 |
≤3 |
|
1/3 |
≤1 |
≤3 |
≤5 |
|
1/4 |
≤2 |
≤4 |
≤7 |
|
1/5 |
≤3 |
≤6 |
≤10 |
|
1/10 |
≤6 |
≤13 |
≤21 |
Table 1 (revised)
No. of defective batches guaranteed by various sampling rates
This paper is reproduced by kind permission of the Institution of Civil Engineers www.icevirtuallibrary.com
